
Sam Darnold
QBSEA · QB22 · Age 29 · 6'3" · 225 lbs · Bye 11
SIT
Bench call at QB20 in Week 7: a thin role leaves him short of the starter line.
Clutch Score 15.7 · the QB12 starter line is 18.2 this week.
- Clutch Score · Wk 7
- 15.7
- Our QB20 this week
- Consensus, wk 7
- QB23
- We disagree by
- +3 spots
Why · what moved the number
Matchup
Hard
KC is the 5th-toughest defense against QBs, on 2026 rates.
Game environment
×1.04
Vegas has SEA at 23.3 implied points, above league average. O/U 43.5, spread -3.
Volume
15
86% of the snaps and 7 touches so far, a role that needs the matchup to cooperate.
Strength of schedule
Weeks 1–18 vs QBs: 9 easy · 6 medium · 2 hard · 2nd easiest of 32
Handcuff
The next man up who’d inherit the workload if Sam Darnold misses time, worth stashing on your bench.
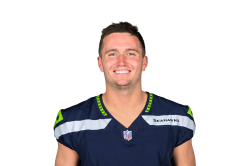 QBDrew LockSEA
Game log · 2026 season
| Wk | Opp | Proj | FPTS | Stat line |
|---|---|---|---|---|
| 1 | vs NE | 0.4 | 0.5 | 13 pass yd · 0 TD · 0 INT · 0 rush yd |
| 3 | @ WAS | 0.0 | 29.7 | 379 pass yd · 4 TD · 2 INT · 5 rush yd |
| 4 | vs LAC | 18.4 | 14.3 | 168 pass yd · 2 TD · 1 INT · 6 rush yd |
| 5 | vs SF | 18.0 | 10.3 | 195 pass yd · 1 TD · 2 INT · 5 rush yd |
| 6 | @ DEN | 13.5 | 13.0 | 278 pass yd · 0 TD · 2 INT · 19 rush yd |
| 7 | vs KC | 14.3 | 15.0 | 257 pass yd · 1 TD · 1 INT · 17 rush yd |
Consistency
How reliable this player has been week to week (PPR).
Ceiling
29.7
Best week
Floor
0.5
Worst week
Avg / game
13.8
Boom rate
17%
Games ≥ 20 pts
Bust rate
17%
Games ≤ 10 pts
Season stats
Pass Yds
1,033
Pass TD
7
INT
7
Rush Yds
35
Rush TD
0
Usage & opportunity
Volume drives fantasy scoring: snaps, touches, and red-zone looks.
Snap share
86%
Of team offense
Carries
7
4.2% of team carries
Red-zone
2
3.7% of team red-zone work
Advanced metrics
What he did with the opportunity, in 2026.
Comp %
60.4%
Completions per attempt
Yds / att
6.9
Per pass attempt
Red-zone att
14
Pass attempts inside the 20
TD reliance
41.3%
Of PPR points
Start instead of Sam

Stats via the Sleeper API (PPR) · updated 14h ago